Green
UN Sustainable Development Goals: How Companies Stack Up
The UN SDGs: How Companies Stack Up
Environmental, social, and governance (ESG) investing witnessed a breakthrough year in 2020 with the most fund inflows on record.
Importantly, for companies that are judged according to ESG metrics, one way to track their progress is through their alignment to the UN Sustainable Development Goals (SDGs).
Established in 2012, the UN SDGs are a blueprint for creating a more sustainable future by 2030 that have been adopted by 193 countries worldwide.
As investors and stakeholders pay closer attention to sustainability concerns, this graphic from MSCI breaks down how companies stack up according to their alignment to the UN SDGs.
How Were Companies Measured?
To track companies net contribution to the UN SDGs, companies were scored by their positive or negative contribution to each of the 17 goals.
The 17 UN SDGs are designed to achieve three primary objectives by 2030:
- Protect the planet
- End poverty
- Create prosperity and peace for all
Specifically, the framework centers on a discussion paper that was developed in partnership with the OECD in 2018. Company policies, operations, products and services, and practices are analyzed according to reported and publicly available information.
Tracking the Alignment of Companies
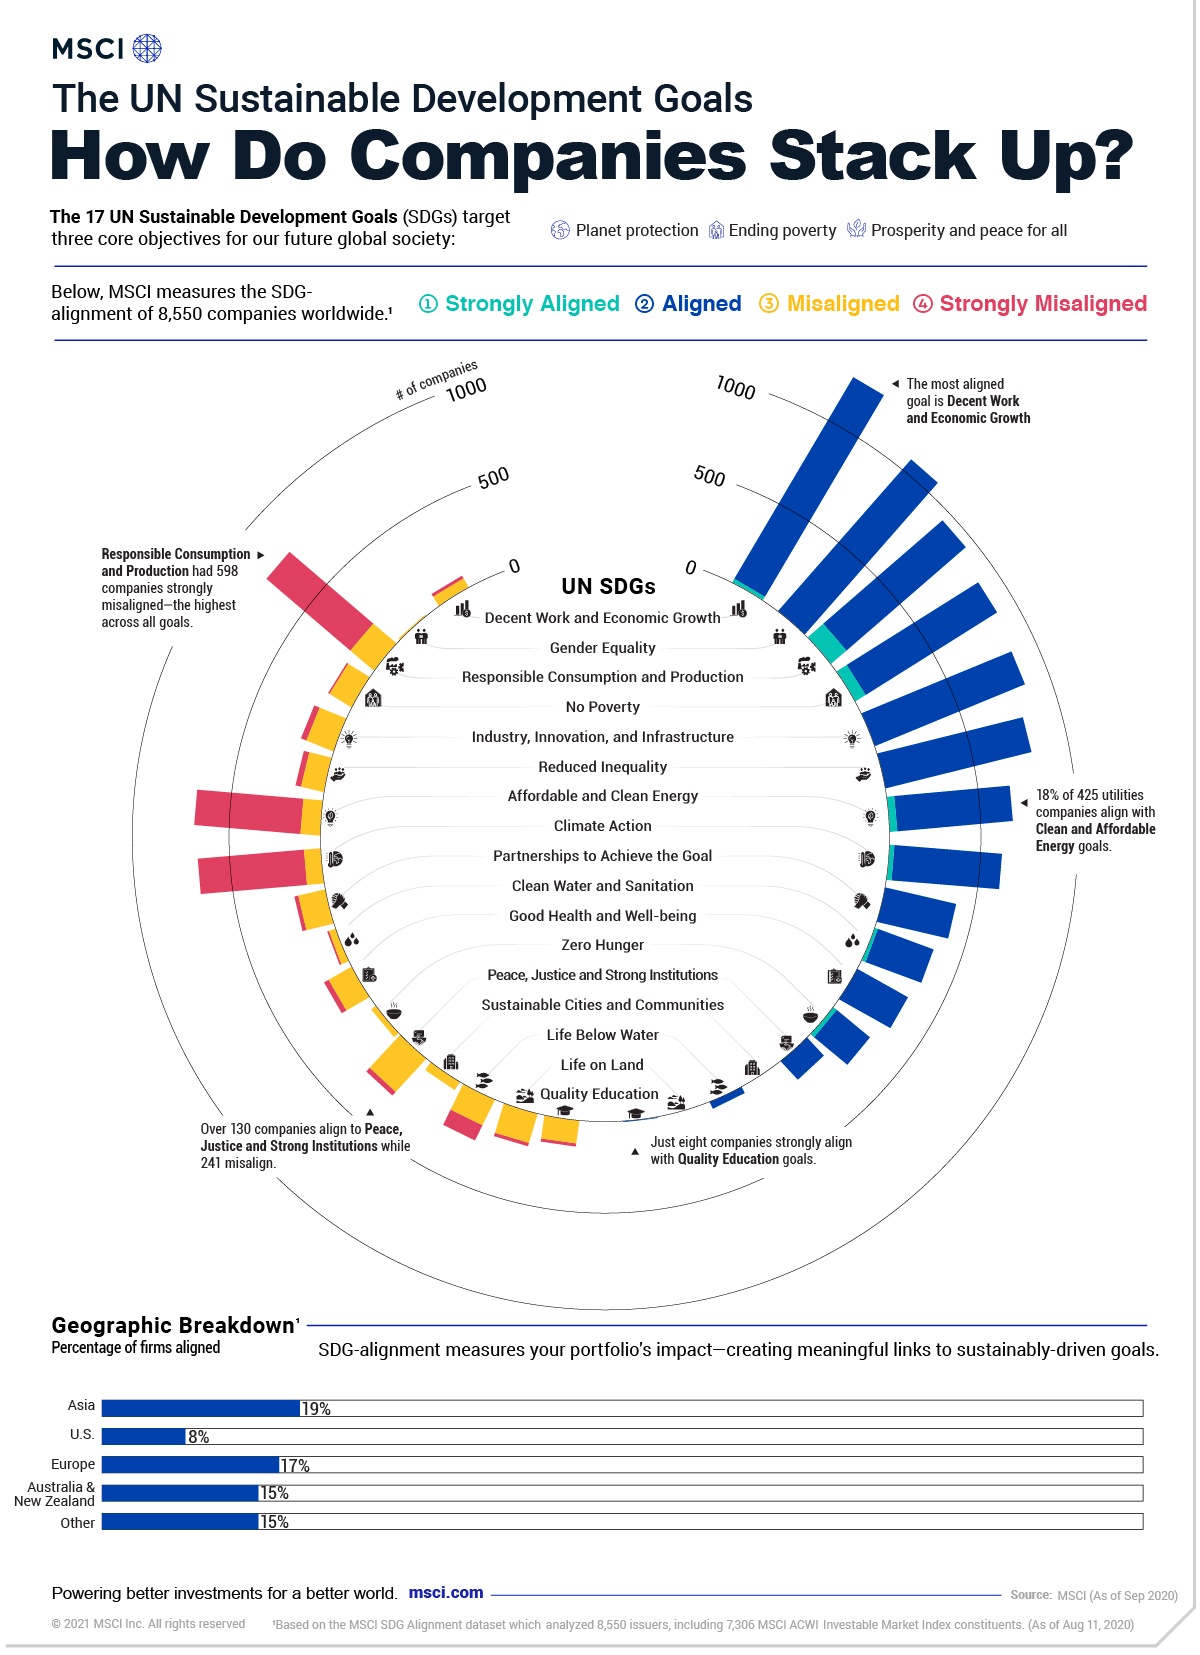
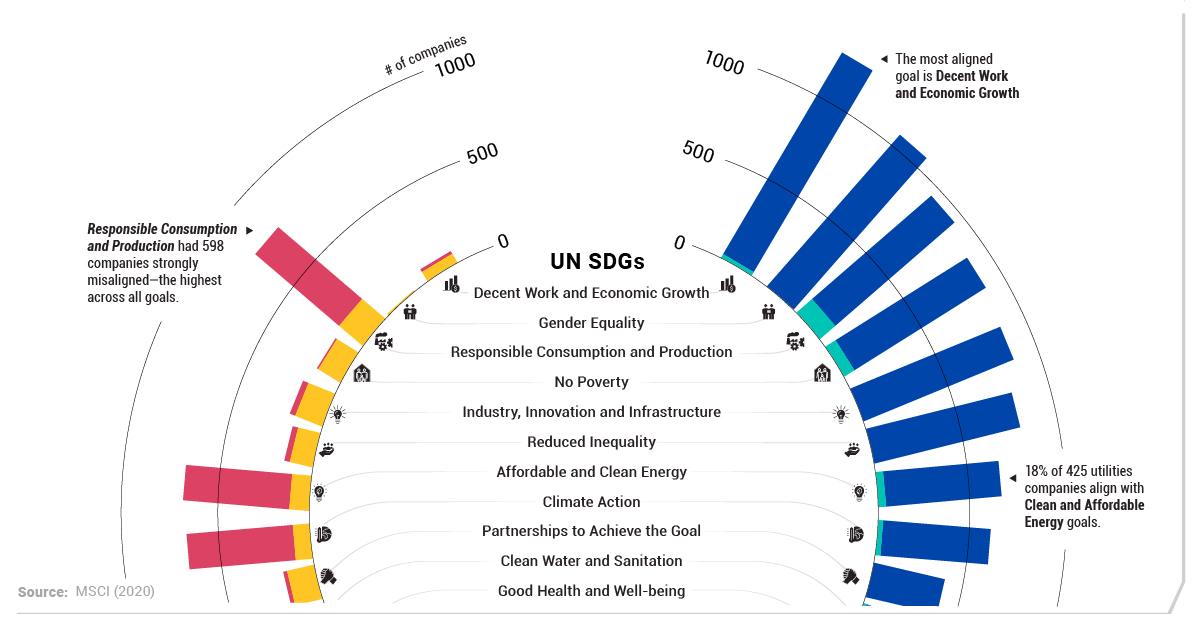
Across a universe of 8,550 companies in the MSCI All Country World Index, constituents were measured from strongly aligned to strongly misaligned to the UN SDGs.
| Sustainable Development Goal | Strongly Aligned | Aligned | Misaligned | Strongly Misaligned |
|
|---|---|---|---|---|---|
| 1 | No Poverty | 0 | 892 | 155 | 32 |
| 2 | Zero Hunger | 24 | 234 | 30 | 0 |
| 3 | Good Health and Well-being | 0 | 315 | 141 | 29 |
| 4 | Quality Education | 8 | 31 | 52 | 0 |
| 5 | Gender Equality | 0 | 1092 | 9 | 0 |
| 6 | Clean Water and Sanitation | 17 | 325 | 36 | 10 |
| 7 | Affordable and Clean Energy | 43 | 639 | 109 | 587 |
| 8 | Decent Work and Economic Growth | 25 | 1269 | 52 | 17 |
| 9 | Industry, Innovation, and Infrastructure | 68 | 844 | 137 | 9 |
| 10 | Reduced Inequality | 0 | 828 | 127 | 31 |
| 11 | Sustainable Cities and Communities | 0 | 0 | 167 | 19 |
| 12 | Responsible Consumption and Production | 115 | 855 | 150 | 598 |
| 13 | Climate Action | 27 | 594 | 95 | 587 |
| 14 | Life Below Water | 0 | 36 | 151 | 92 |
| 15 | Life on Land | 0 | 0 | 128 | 17 |
| 16 | Peace and Justice Strong Institutions | 0 | 135 | 241 | 27 |
| 17 | Partnerships to Achieve the Goal | 0 | 401 | 152 | 22 |
Source: MSCI ESG Research LLC as of August 11, 2020
Broadly speaking, companies fell mostly in the middle—roughly 38% were aligned while almost 55% were misaligned or neutral. Meanwhile, just 0.2% of companies were strongly aligned to the UN SDGs.
Overall, one of the most strongly aligned goals was Responsible Production and Consumption, with 115 companies meeting this criteria. Specifically, these include companies that are building sustainable infrastructure, energy efficiency, or creating green jobs.
Interestingly, the worst performing goal was also Responsible Production and Consumption, with over five times as many companies (598) strongly misaligned. Along with this goal, both Climate Action and Affordable and Clean Energy each had over 500 companies strongly misaligned.
UN SDGs: A Sector Focus
Unsurprisingly, SDG-alignment varied widely according to company sectors.
Educational companies, for instance, represented the highest level of alignment to Gender Equality. Meanwhile, 18% of 425 utilities companies assessed ended up aligning with Clean and Affordable Energy goals.
As one would expect, the energy sector lagged behind. In 2020, fossil fuels were a key source of revenue for 91% of the companies in the energy business. In fact, just three companies derived over 50% of their revenues from green alternatives: REX American Resources, Renewable Energy Group, and Verbio.
A Call to Action?
Despite the growing wave of interest in ESG investing, the reality is that progress to meet the UN SDGs has been slower going than expected.
However, a greater number of individuals, stakeholders, and activists are sounding the alarm. Today, over 3,000 signatories representing trillions in assets under management have committed to the UN Principles of Responsible Investment, which has established six key actions for ESG investing. Now, many companies are required to report their ESG disclosures in Europe.
Along with these key markers of progress, investors can move the dial by tracking a company’s alignment to sustainable development goals.


Green
Ranking the Top 15 Countries by Carbon Tax Revenue
This graphic highlights France and Canada as the global leaders when it comes to generating carbon tax revenue.


Top 15 Countries by Carbon Tax Revenue
This was originally posted on our Voronoi app. Download the app for free on iOS or Android and discover incredible data-driven charts from a variety of trusted sources.
Carbon taxes are designed to discourage CO2 emissions by increasing the cost of carbon-intensive activities and incentivizing the adoption of cleaner energy alternatives.
In this graphic we list the top 15 countries by carbon tax revenue as of 2022. The data is from the World Bank’s State and Trends of Carbon Pricing Report, published in April 2023.
France and Canada Lead in Global Carbon Tax Revenue
In 2022, the top 15 countries generated approximately $30 billion in revenue from carbon taxes.
France and Canada lead in this regard, accounting for over half of the total amount. Both countries have implemented comprehensive carbon pricing systems that cover a wide range of sectors, including transportation and industry, and they have set relatively high carbon tax rates.
| Country | Government revenue in 2022 ($ billions) |
|---|---|
| 🇫🇷 France | $8.9 |
| 🇨🇦 Canada | $7.8 |
| 🇸🇪 Sweden | $2.3 |
| 🇳🇴 Norway | $2.1 |
| 🇯🇵 Japan | $1.8 |
| 🇫🇮 Finland | $1.7 |
| 🇨🇭 Switzerland | $1.6 |
| 🇬🇧 United Kingdom | $0.9 |
| 🇮🇪 Ireland | $0.7 |
| 🇩🇰 Denmark | $0.5 |
| 🇵🇹 Portugal | $0.5 |
| 🇦🇷 Argentina | $0.3 |
| 🇲🇽 Mexico | $0.2 |
| 🇸🇬 Singapore | $0.1 |
| 🇿🇦 South Africa | $0.1 |
In Canada, the total carbon tax revenue includes both national and provincial taxes.
While carbon pricing has been recognized internationally as one of the more efficient mechanisms for reducing CO2 emissions, research is divided over what the global average carbon price should be to achieve the goals of the Paris Climate Agreement, which aims to limit global warming to 1.5–2°C by 2100 relative to pre-industrial levels.
A recent study has shown that carbon pricing must be supported by other policy measures and innovations. According to a report from Queen’s University, there is no feasible carbon pricing scenario that is high enough to limit emissions sufficiently to achieve anything below 2.4°C warming on its own.

-

 Green2 weeks ago
Ranked: Top Countries by Total Forest Loss Since 2001
-

 Travel1 week ago
Ranked: The World’s Top Flight Routes, by Revenue
-

 Technology1 week ago
Ranked: Semiconductor Companies by Industry Revenue Share
-

 Money2 weeks ago
Which States Have the Highest Minimum Wage in America?
-

 Real Estate2 weeks ago
Ranked: The Most Valuable Housing Markets in America
-

 Markets2 weeks ago
Charted: Big Four Market Share by S&P 500 Audits
-

 AI2 weeks ago
The Stock Performance of U.S. Chipmakers So Far in 2024
-

 Automotive2 weeks ago
Almost Every EV Stock is Down After Q1 2024